I have continued to think about Professor Muhanna's closing statement, about how in an age of increasingly sophisticated arguments, one must not need to argue an accurate, but rather a sophisticated argument, in order to be correct. Given the high volume of information and possible explanations to any situation, decision making and power will continue to lie in the lo-fo power of charisma and other affective persuasion.
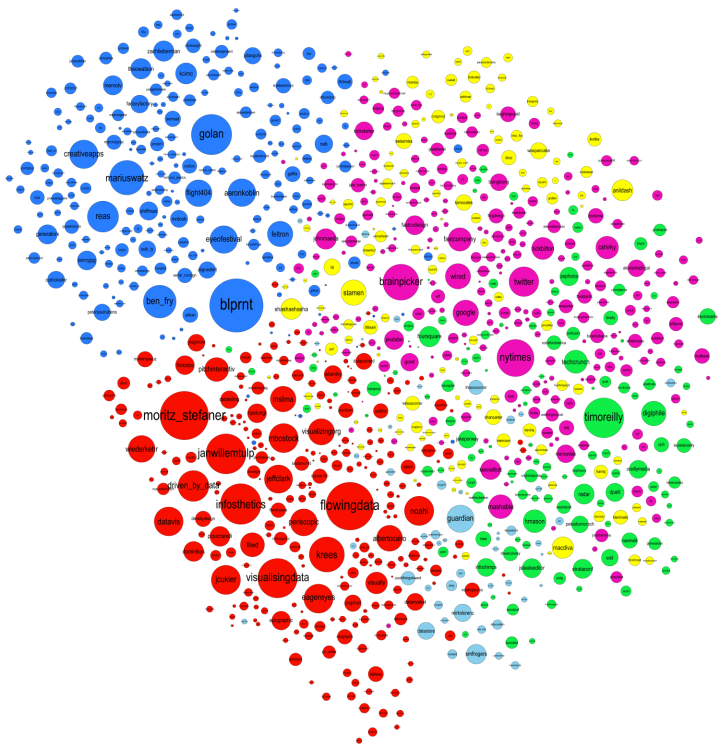
After Professor Muhanna's lecture, we were forwarded a link to the map of the Arabic blogosphere in 2009, which I believe was trying to say something about the density, frequency, or prevalence of certain factors in that community. It's really not clear to me now what I should have gotten out of that chart, or even why the image exists.
Ultimately, I think the simplicity and simultaneous complexity of this image is attempting to tell me that the information in it is important - without anything districting in the details, the ur-relationships of the blogosphere must become apparent. Just as Muhanna had referenced the volume of video footage with confusing meaning, this exercise in restraint does the same thing. It is persuasuve without informing. It is also so ambiguous that it could be describing anything: like renewable energy genes (image 1) or data viz subgroups themselves (image 2). I think Muhanna reinforced in practice that the desire for mapping, as described by Jameson in the first weeks of our course, is still very much an unanswered need. How can we understand the world without reducing it down to circles?


No comments:
Post a Comment